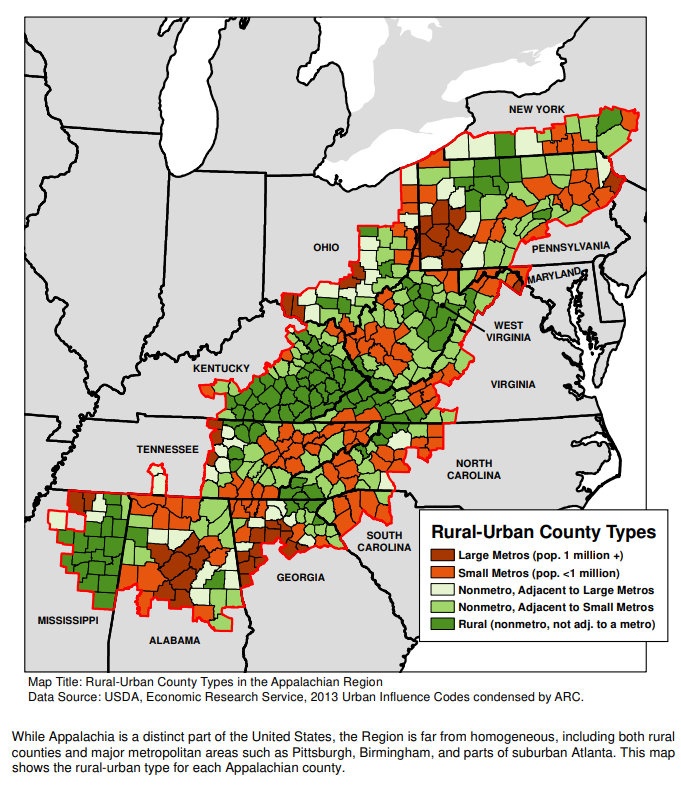
The Appalachian Regional Commission reports that Appalachia’s overall population is declining. The Northern and North Central Appalachia regions including Pennsylvania, Ohio, West Virginia, Virginia, and New York are declining the most. In contrast, Southern Appalachia, especially Georgia, is experiencing a population growth–greater than the national average in some counties.
Appalachia had a population of 26.1 million in 2020.
Over the past decade Appalachia’s population growth was 2%, much slower than the national trend of 6.5%
Most of Appalachia has lost population since 2010.
A diversified economy is the most influential factor determining population gain or loss among Appalachian counties.
Appalachia’s population is growing older, but aging at about the same rate as the US in general.
Appalachia’s median age (the point at which half the population is older and half is younger) is 41.4 years, up 1.5 years over the past decade.
In general, the number of younger people who live in Appalachia (below the median age) is declining.
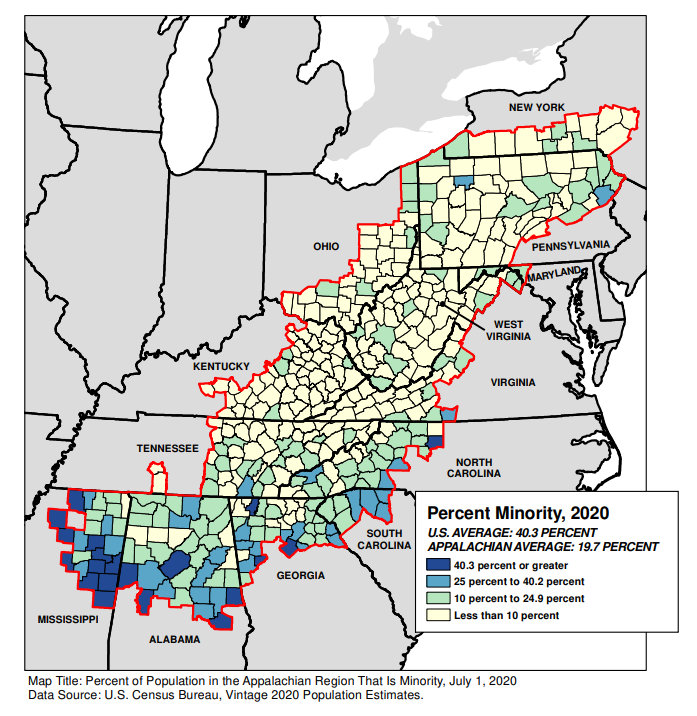
The Appalachian Region has become more racially and ethnically diverse, as more people identify with a racial or ethnic group other than “white alone, not Hispanic.”
Although African Americans are the largest minority group in Appalachia, Hispanics populations are faster growing and in some counties (especially in the Southern Appalachian region) surpassing black populations.
Adjusting for inflation, income trends (mean and median household income, mean and median family income per capita), for Appalachia in general were positive over the past decade, but still below national averages.
Income growth was the least in Northern and Central Appalachia regions.
Overall, poverty decreased throughout Appalachia, with the slowest poverty reduction rates in the Central and Northern Appalachia.
Poverty rates among working-age adults (ages 25 to 64) declined the least in Central and Northern Appalachia.
Poverty rates for older older residents (ages 65 and over) rose slightly in Northern and North Central regions of Appalachia, such as Pennsylvania, New York, Ohio, and West Virginia.
While overall participation decreased among Appalachian households receiving benefits for the federal Supplemental Nutrition Assistance Program (SNAP, aka “food stamps”), Appalachian Pennsylvania and West Virginia saw a noticeable increase.
Overall, the income and poverty trends in the Appalachian Region since 2011-2015 show that poverty levels have fallen while incomes have risen, suggesting that much—if not most—of Appalachia has recovered economically from the 2007-2009 recession. However, the economic impact of the COVID-19 pandemic—plus other economic concerns—may end up reversing some of these gains.
Beaver County: More Urban - Less White
Source: The Appalachian Region: A Data Overview from the 2016-2020 American Community Survey Chartbook
Source: The Appalachian Region: A Data Overview from the 2016-2020 American Community Survey Chartbook
White Populations
80.3% white = Appalachia Region
86.8% white = Northern Appalachia Sub Region
86.7% white = Pennsylvania Appalachia
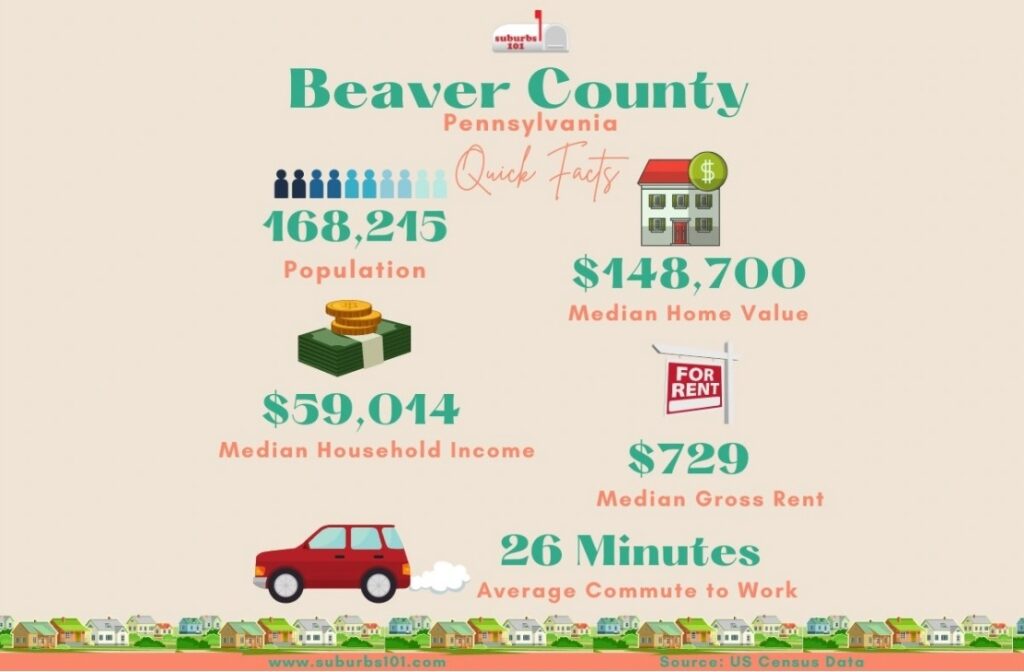
Beaver County and its neighboring counties:
95.5% = Butler County, PA
95.0% = Columbiana County, OH
94.6% = Hancock County, WV
93.1% = Washington County, PA
92.4% = Lawrence County, PA
90.1% = Beaver County
79.4% = Allegheny County, PA
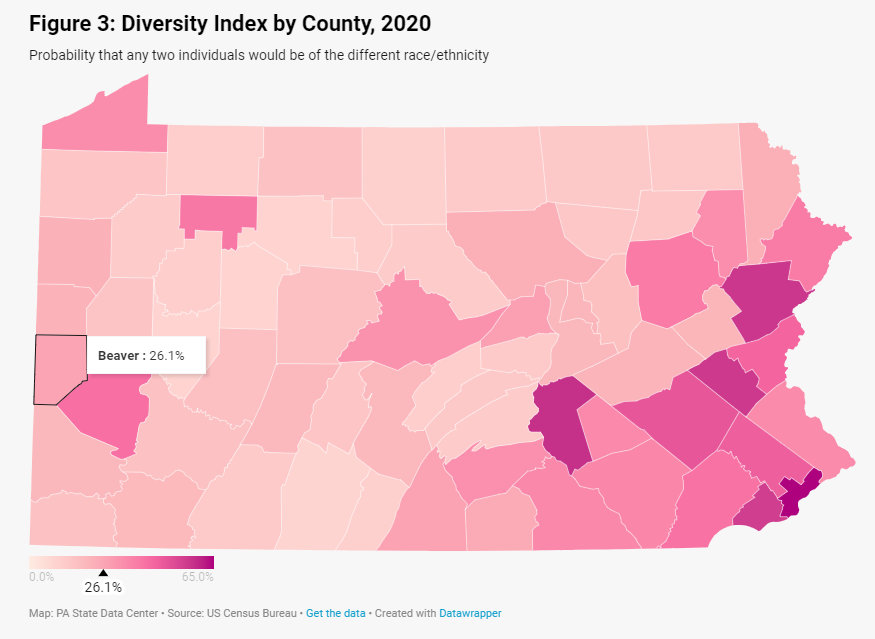
The Diversity Index (DI) gives us a statistical sense of the racial/ethnic mix of a county. For example, Beaver County’s DI is 26.1%, meaning that there is better than a 1 in 4 chance that any two people in Beaver County will be of a different race or ethnicity. Allegheny’s DI is 41.6%, meaning that there is almost a 50% chance that any two people will be of a different race or ethnicity. Over the past decade, Beaver County and all its surrounding counties have become more diverse. Here is a listing from the most to least diverse:
Allegheny County = 41.6% (↑8.4%)
Beaver County = 26.1% (↑8.3%)
Lawrence County = 21.9% (diversity index ↑8.9%, greatest gain in diversity)
Washington County = 20.0% (↑7.4%)
Hancock County, WV = 18% (↑8%)
Columbiana County, OH = 16% (↑6%)
Butler County = 15.4% (↑7.3%)
Source: Suburbs101.com
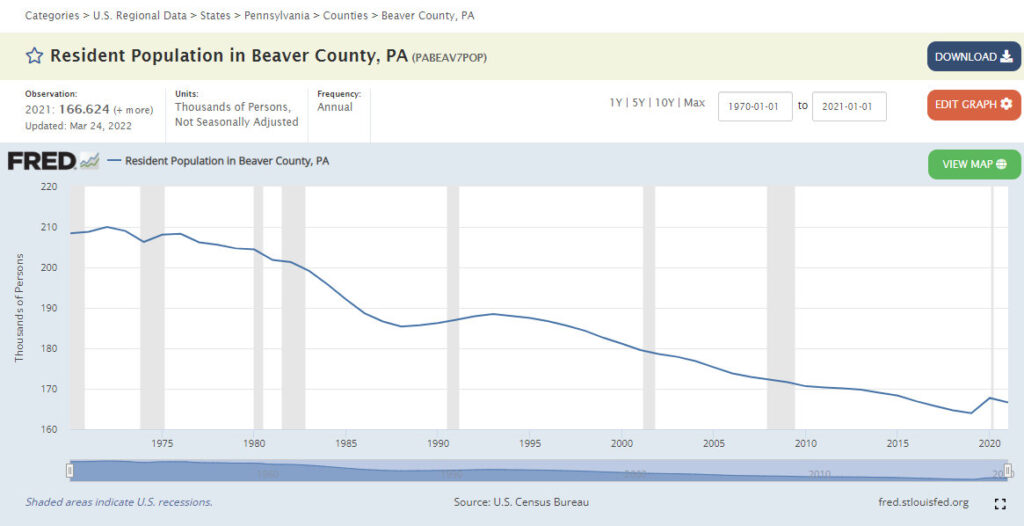
Source: FRED Economic Data
Pollution
Population Decline
Resistance to Change
Shaping the Future
Rethinking Communities
Sustainability Inclusivity & Diversity Creativity
Engaging Activism
Social Justice Environmental Justice Participatory Democracy
Evolving Historical Thinking
Critical Perspectives Cultural & Social Issues Public History Focus
You must be logged in to post a comment.